


Understanding and viewing your mining statistics on the Ordina pool
You will find the statistics home panel at the URL https://dashboard.ordina-mining.com. Once the page has loaded, enter your crypto wallet address.
Enter the bitcoin address in the text field.
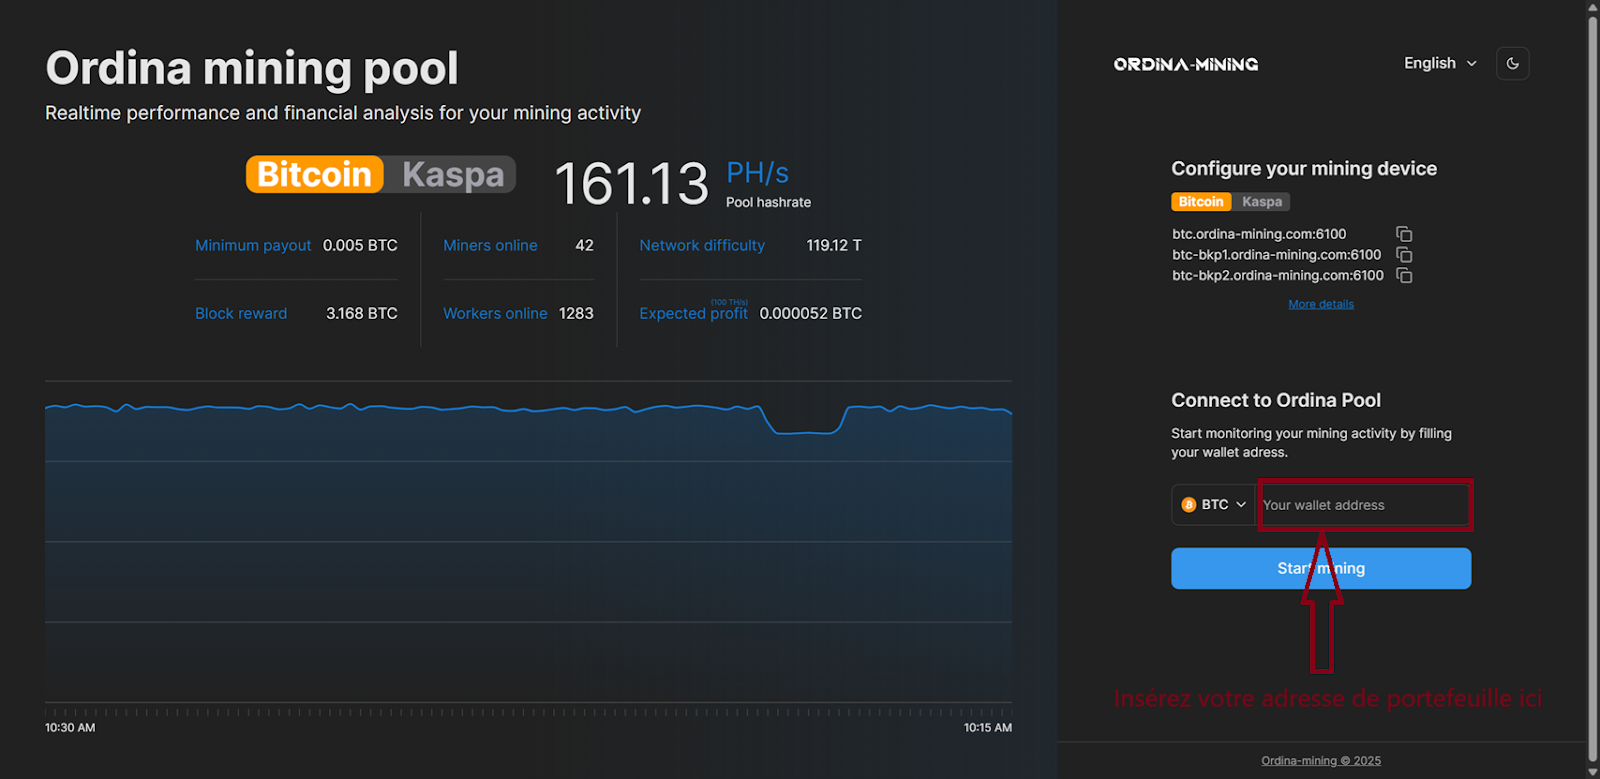
-
Understanding the “Dashboard” panel
Once you have entered your address, click “Start mining” and you will be redirected to the dashboard.
The menu on the left contains:
-
“Dashboard” (the tab currently active in the image below, as it is shown in blue): your mining data across all your machines connected to the pool.
-
“Workers”: a list of your machines, broken down by the name you chose.
-
“Earnings”: a summary of your mining earnings.

1) Real time hashrate: 53.96 PH/s
-
Definition: the current computing power provided by all the miners at a given moment.
-
Purpose: lets you check in real time that everything is working normally. If this value suddenly drops, it may indicate a hardware or network problem.
2) Avg hashrate 3h: 53.80 PH/s
-
Definition: average computing power over the last 3 hours.
-
Purpose: smooths out temporary fluctuations; useful for spotting trends or gradual drops.
3) Avg hashrate 24h: 53.81 PH/s
-
Definition: average computing power over the last 24 hours.
-
Purpose: an indicator of long-term stability. Very useful for tracking the efficiency of the farm in an overall, stable way.
4) Workers: 328 Online / 3 Offline
-
Definition: total number of miners connected to the pool, split between those that are running (online) and those that are not responding (offline).
-
Purpose: helps you spot faulty or disconnected machines immediately.
5) Expected earnings 24h: $2914.35 / 0.0282101 BTC
-
Definition: an estimate of the revenue you will earn over 24 hours at the current hashrate.
-
Purpose: gives a clear forecast of expected earnings, to optimise profitability or compare different times/days.
6) Balance: 0.003522 BTC
-
Definition: current balance in the wallet linked to your pool account.
-
Purpose: shows mined earnings that have not yet been withdrawn. They can be transferred manually or automatically depending on your settings.
2) Understanding the “Workers” panel
This panel lets you monitor the activity of your mining machines (ASICs) in real time. Here is how to read and use each part of the interface.
1. Main section (top)
|
Item |
Description |
|
Workers |
Total number of machines connected to the pool. Here, 60 are online and 1 is offline. |
|
Asics owned |
Total number of ASICs owned in your farm: 67. |
|
Valid shares (24h) |
Total valid shares submitted in 24h: 279,330, i.e. 99.85%, which is excellent. |
|
Invalid shares (24h) |
Number of invalid shares (errors) in 24h: 0, so perfect. |
|
Stale shares (24h) |
Number of stale shares (submitted too late): 429, i.e. 0.15% (low, so good). |
|
Efficiency (24h) |
Overall pool efficiency over 24h: 100%, which means all your machines are working properly. |
2. Worker activity (bottom)
This table gives you detailed information on each connected machine:
|
Column |
Meaning |
|
Name |
Machine identifier (often based on its hash or a custom label). |
|
Status |
Current state (Online = running, Offline = stopped). |
|
Real Time |
Current hashrate (in TH/s). |
|
3h Avg / 24h Avg |
Average hashrate over 3h and 24h. Useful for spotting drops in performance. |
|
Valid shares (15min) |
Valid shares submitted in the last 15 minutes. |
|
Invalid shares (15min) |
Errors over the last 15 minutes (should stay at 0). |
|
Stale shares (15min) |
Shares that recently arrived too late (should stay at 0). |
|
Last Share |
Time of the last share received: checks that the machine is working properly. |
3) Understanding the “Earnings” panel

This panel lets you track your mining earnings in Bitcoin (BTC) in a simple, visual way. Here is how to read each part of the screen.
1. Estimated revenue
|
Box |
Description |
|
Expected hourly |
What you earn every hour, here: 0.0001234 BTC, i.e. $12.77. |
|
Expected daily |
Expected revenue per day: 0.0029617 BTC, i.e. about $306.57/day. |
|
Expected weekly |
Expected revenue per week: 0.0207316 BTC, about $2146.01. |
|
Expected monthly |
Estimated monthly revenue: 0.0888496 BTC, i.e. $9197.18. |
💡 These amounts are estimates based on your current computing power and may fluctuate depending on network difficulty and the Bitcoin price.
2. Balance tracking
|
Item |
Explanation |
|
Last 24h balance |
BTC actually mined over the last 24 hours: 0.002724 BTC. |
|
Balance |
Current amount not yet transferred to your wallet: 0.005726 BTC. |
|
Threshold |
Minimum threshold for automatic payout: here 0.005 BTC. Once this threshold is reached, the amount is sent automatically to your address. |
3. Payout history
Below, you have a bar chart (purple) showing the daily transfer amounts, and a blue line showing the average trend.
|
Item |
Purpose |
|
Purple bars |
Amount of BTC sent each day (or other selected period). |
|
Blue curve |
General trends (rising or falling revenue). |
|
Period |
You can choose the period to analyse using the date picker at the top right (e.g. 10 April → 10 May 2025). |
4. Payout address
At the bottom left, you can see the wallet name and the associated Bitcoin address, to which payouts are sent automatically once the threshold is reached.
Key takeaways
-
If your balance exceeds 0.005 BTC, an automatic payout is triggered.
-
You can optimise your earnings by keeping all your machines online and performing well.
-
The chart helps you analyse changes in profitability and detect anomalies.